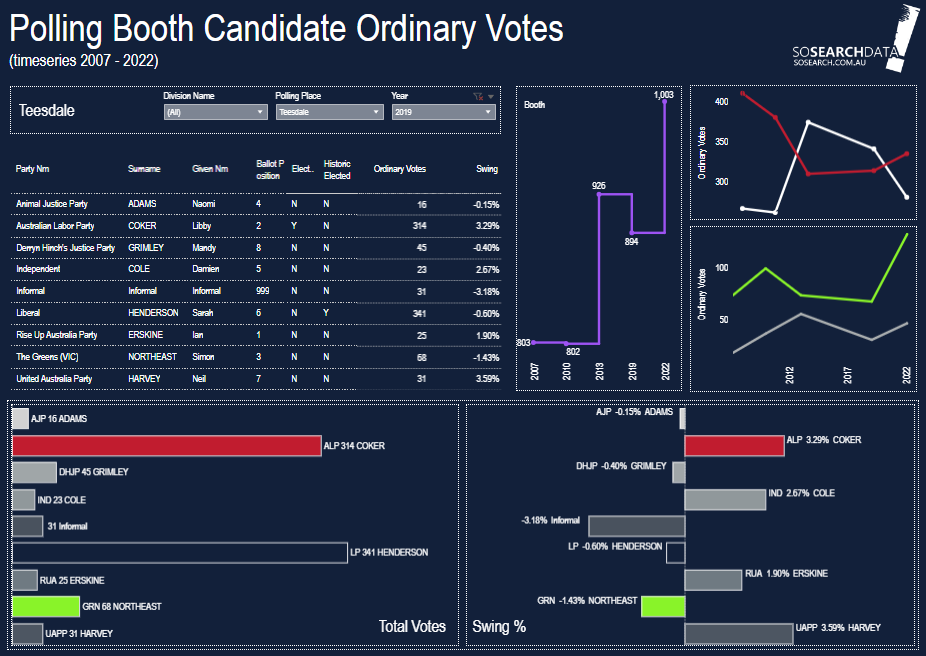
Quickly identify the trend of votes Liberal Party, Labor Party, Greens and the informal votes cast at the polling booth. as well as a quick overview of votes cast at the selected polling booth from 2007 – 2022.
The Table outlines all political party’s election results for the year at the Polling Booth Selected.
Mouse over the all charts to view the information associated with the chart output:
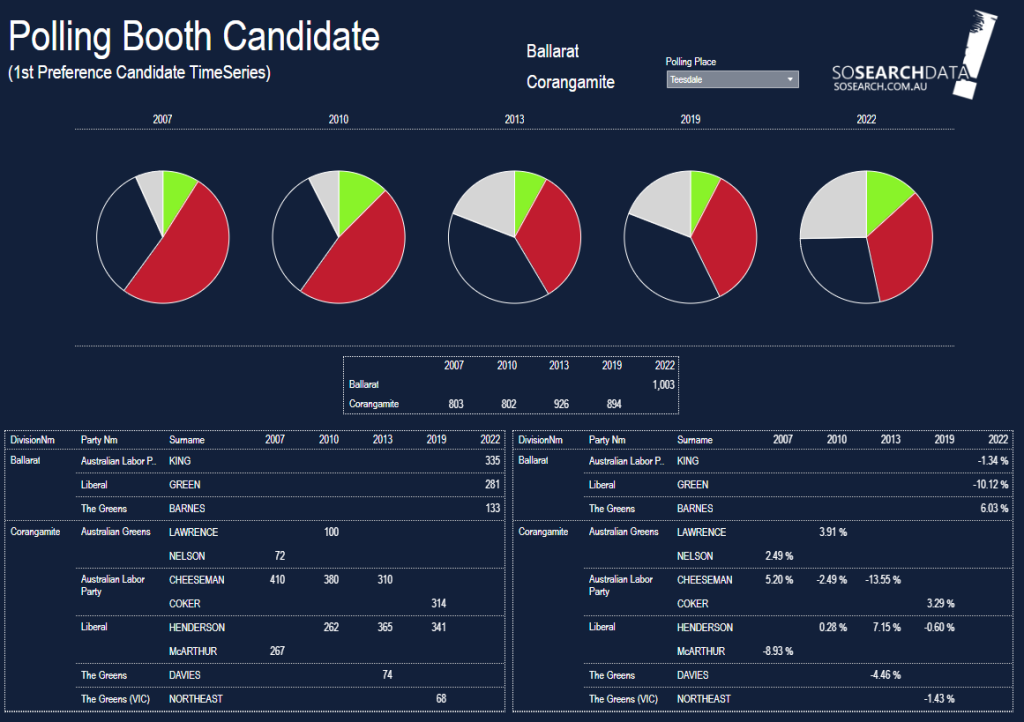
Note: When selecting the Division you may not see the polling booth if at the Boundary Redistribution the Polling Booth changed divisions.

Teesdale is one of the many polling booths that have been disrupted by the Redistribution of Federal Electoral Boundaries.
Beneath the pie chart is a table that clearly states the number of votes cast at the polling booth by year and what Division.
The two tables in the lower section of the dashboard identify the Political Party, Candidate Name and the number and swing per election year
Click on a slice of pie in the chart section to view popup window:
There is two ways that you can find your streets SA1 neighbourhood code.
Filter
Simply just Zoom into the map and locate your neighbourhood’s SA1 code
If you want to change the map area you will need to remove all of the filters you have applied.
To do this you need to:
Mouse over the filter slowly to the top right hand side.
A grey filter icon appears and if there is any conditions applied there will be a red (X).
Click on this red (X) to remove the filter and ensure that SA1, SA2, SA3, SA4 do not have a red (X).
You will then be able to view all areas to begin another area analysis
The bar at the bottom of the interactive dashboard on the right hand side has a downward arrow. #Click this and a pop up window appears.
Select: Download to create the PDF.
www. abs.gov.au/statistics/standards/australian-statistical-geography-standard-asgs-edition-3/jul2021-jun2026/main-structure-and-greater-capital-city-statistical-areas/statistical-area-level-3
