Hi All who have found their way to this webpage looking for information.
To get the data prepared for the below interactive dashboards, there is a lot of work that is needed to be done before hand. The VEC isn’t as kind to us analysts that love digging into their results as the FEC is. On this website there are several finished interactive story lines for the Federal Elections from 2004 – 2022, as the data is easily downloadable, prepped and shaped into the format needed to produce the data reports you are looking for.
Currently there are only 3 Victorian State Seats of data available in the two dashboards on this web page for the year of 2022. I am reaching out to any person that may have the whole set of results in a CSV or .xlxs format that you can provide me. I am offering all this information for free and will not be charging people ever for it, so I am hoping that someone else can maybe ‘pay it’ forward to me.
Regards
Shandra Cohen
3rd April 2024

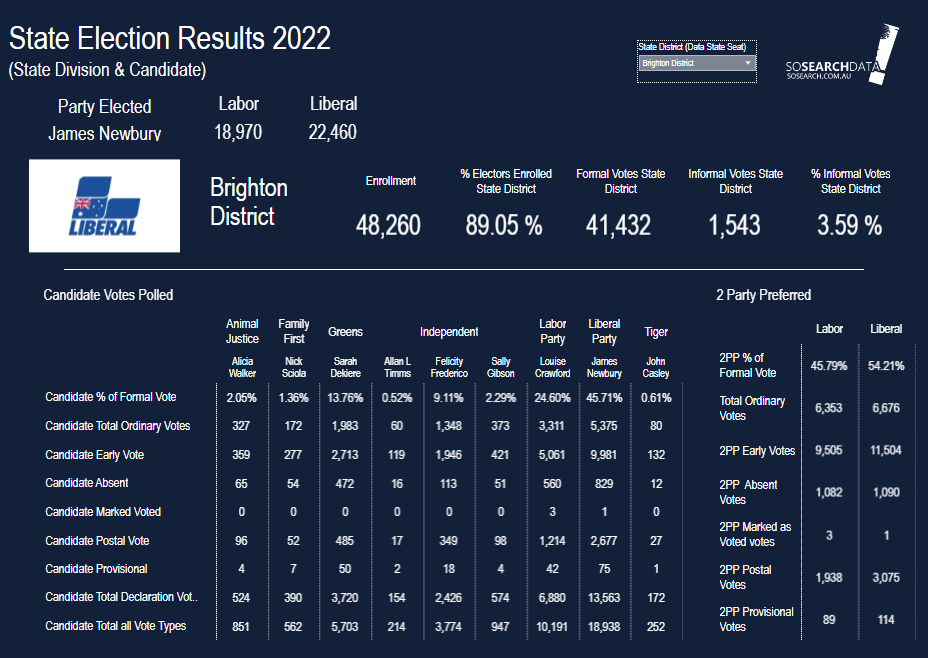
Victoria has 88 State Seats of Polled Votes. This dashboard enables you to filter on each State Seat of Victoria and instantly which candidate received the most votes based on the 2PP and what political party there values are aligned with.
You get a brief statistical view of the number of people eligible in the State Seat and how many of these people chose to vote.
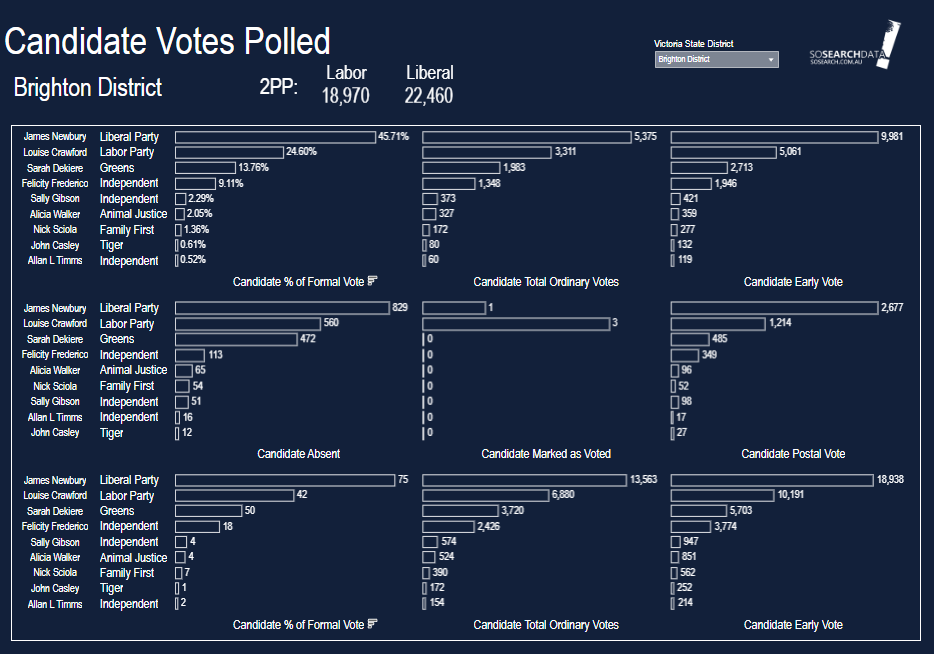
Candidate Votes Polled
Answers the question of human behaviour when casting their vote, and to which candidate they their vote went.
2 Party Preferred
Answers the questions of human behaviour and where their preferences eventually flowed.

Interactive report for each State of Victoria that provides details in chart format for each candidate at each State Seat.
There is two ways that you can find your streets SA1 neighbourhood code.
Filter
Simply just Zoom into the map and locate your neighbourhood’s SA1 code
If you want to change the map area you will need to remove all of the filters you have applied.
To do this you need to:
Mouse over the filter slowly to the top right hand side.
A grey filter icon appears and if there is any conditions applied there will be a red (X).
Click on this red (X) to remove the filter and ensure that SA1, SA2, SA3, SA4 do not have a red (X).
You will then be able to view all areas to begin another area analysis
The bar at the bottom of the interactive dashboard on the right hand side has a downward arrow. #Click this and a pop up window appears.
Select: Download to create the PDF.
www. abs.gov.au/statistics/standards/australian-statistical-geography-standard-asgs-edition-3/jul2021-jun2026/main-structure-and-greater-capital-city-statistical-areas/statistical-area-level-3
